IMPROVING ROAD SAFETY THROUGH SMARTER DATA PROCESSING AND TREND ANALYSIS
With the aim of reducing the risk of accidents on our road networks through the implementation of smarter, data-driven road safety measures, a new analysis tool is saving local governments precious time and money.
Data management is a challenge for small and large organisations around the world. A common thread across many industries and sectors is the struggle to find the right tools, knowledge and resources to help them be more effective at their jobs and enable them to make better decisions.
However, one main impediment for data analysts is the time that goes into the preparation and processing of data.
According to Trifacta's 2018 global survey, 60% of IT professionals spend half or more of their time at work on data preparation, quality assurance and clean-up, which is costing organisations over $450 billion USD.
Fifty nine per cent of these survey respondents believed that this work time costs their organizations money more than it delivers value.
Data collection can be a painstaking task
One type of public organisation that is struggling in particular is municipal governments, especially traffic engineers and analysts in transport departments.
Many teams simply do not have the time or resources available to perform the prerequisite studies and analyses in-house, especially when datasets, such as road accident data, are enormous in size and somewhat difficult and time consuming to find, gather and analyse.
Typically, each individual municipality orders a large-scale road traffic accident report every few years from a consultant, or must manually go through the intensive process of preparing and analysing a report themselves.
Some even neglect the task entirely due to lack of time or priority, and risk letting this critical job slip through the cracks. Getting these insights correct is fundamental, as they are a basic requirement for implementing accident prevention measures on road networks and launching public safety campaigns.
A simple and logical solution
To address the need for quick and efficient accident data compilation and analysis, we have developed a new tool called Uheldsportalen (aka The Accident Portal).
The tool is based on a thorough user-testing programme with real clients, to get a better understanding of their specific needs and requirements, which we used to co-create an optimum, albeit simple, initial solution for the launch of the portal.
In essence, The Accident Portal is a web-based tool that can help local traffic engineers identify accident locations and trends on their road networks, which can then be used as a basis for the implementation of safety initiatives to improve road safety and behaviour.
The portal pulls police registered traffic accident datasets from Vejman.dk, a Danish Road Directorate database, and processes the information at high-speeds to display intuitive graphs, maps, and statistics.
Since launching in late 2017, we have continued to listen to user feedback and develop the portal through small, iterative improvements and build additional unique features.
The tool in action
The Accident Portal sources public information focused primarily on: 1) the who: the driver's current age, gender, etc.; 2) the where: location of each accident; 3) the when: the time and date; and 4) the how: the nature of the accident and damage incurred.
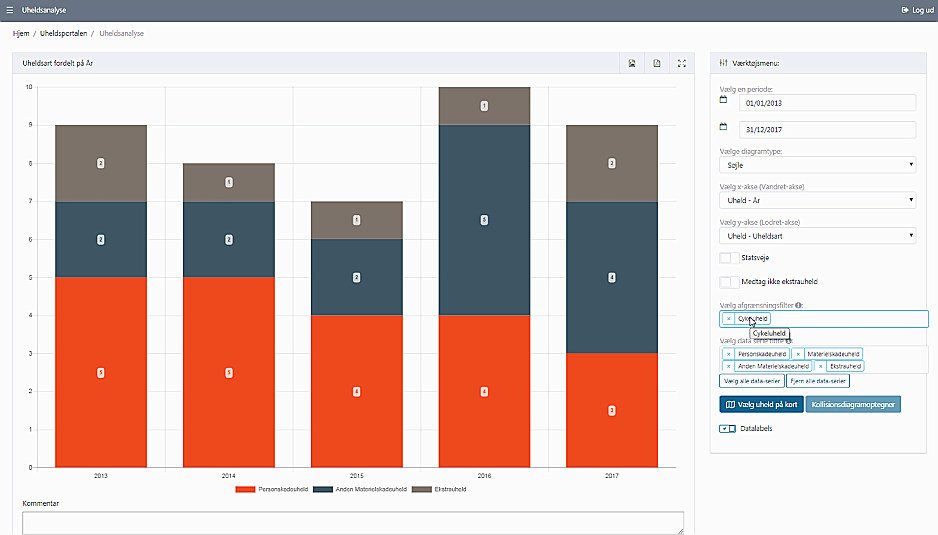
Using this information, the theme analysis generator allows users to compare accident trends over time, and on a map, helping to identify priority areas for traffic safety efforts. Users can also customise their view in the graph builder tool using one or more filters.
For example, they may just want to see accidents involving bicycles, or only during rush hour, or near road curves.
With multiple filters, users could visualise accidents involving cars in road curves in open land, or accidents during rush hour involving young cyclists between the ages of 5-16 years. The sample diagram below shows personal injuries sustained during accidents over a defined number of years.
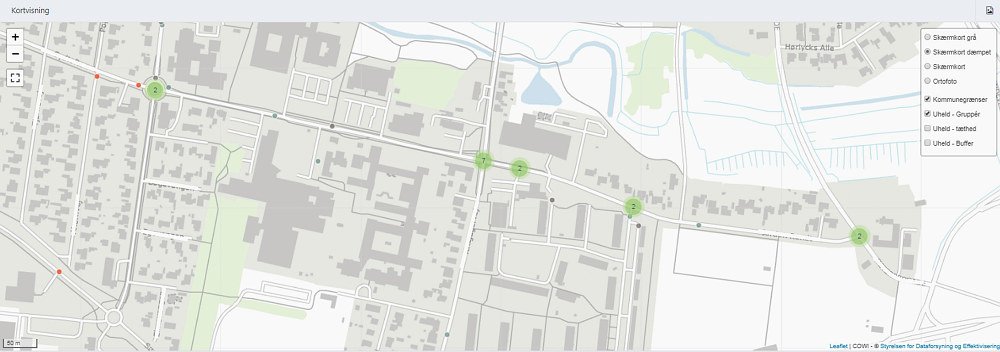
You can even drill down the data by geographical region or accident hot spots on a density heat map, or use a mapping feature to show a count of accidents within the same geographical location to help with black spot analysis (as demonstrated below).
Another valued feature is the road traffic safety knowledge-sharing forum, which collects information on accident prevention and safety initiatives from published articles, handbooks, legislature, and research studies, all in one convenient location.
A giant leap for the traffic engineer
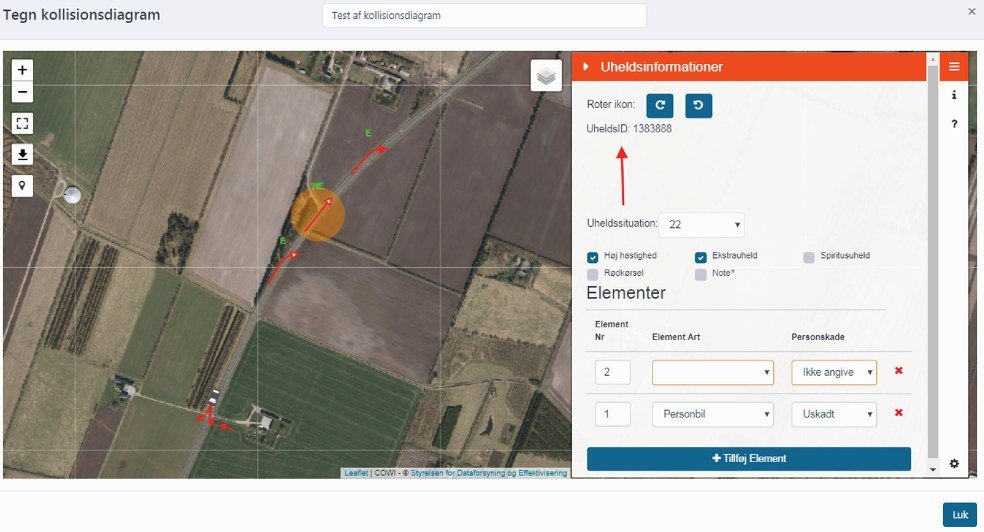
In our latest release this past July, we launched several updates and new features, including a new collision diagram feature. Historically, the only option for traffic engineers to illustrate collisions was with freehand drawings.
However, with The Accident Portal, collision diagrams generate automatically within the application to show how a vehicle or bicycle lost control on the road. Users can click on different areas within the diagram to extract the numbers behind each data point. The feature is one small step for man but a giant leap for the traffic engineer.
Compiling reports in seconds instead of weeks
Looking at the average time spent on traffic safety work, we have calculated that by using The Accident Portal, local governments will see:
- Savings of approximately 70 hours per year on accident analysis alone
- Annual cost savings of over €10,000 per user (assuming an hourly rate of €67)
- An 80% decrease in hours spent per year manually processing data
One of the most beneficial features for local governments is the annual reporting function. Each year, municipalities produce annual collision and traffic safety reports to make local politicians aware of the ongoing developments in traffic safety.
This usually takes weeks to compile, but with The Accident Portal, they are now able to export elements and graphs in the require report format in mere seconds.
We plan to launch a number of new features within the next year, which will further reduce the time required for manual analysis and further enhance the user's experience and capabilities. This may include features like a smart table reader, chat functionality and GIS mapping capabilities.
Over time, we hope that The Accident Portal will become a staple in the local government toolbox as they realise cost and time-saving benefits and reduce uncertainty through accurate and consistent reporting.
Ultimately, though, we hope this will result in decreased accident rates and safer road networks.
MEET THE EXPERT
I am a civil engineer and project manager specialising in urban planning and transport, primarily focused on road infrastructure planning, research and development, traffic techniques, road markings, traffic safety, and accessibility planning.
I am a certified road safety auditor and certified accessibility auditor.
Since late 2017, the development and enhancement of the The Accident Portal has been my main priority.
Get in contact

Thomas Rud
Project Manager
Transport Planning, Denmark
Tel:
+45 56403905
tsrd@cowi.com